
You have the figures. You can pull reports per carrier, per destination, and per month. Yet, freight often ends up as a line item in the financial statements that management only looks at when it increases. The utilization of transport agreements and freight data rarely becomes a standalone item on the management meeting agenda, and this is usually not due to data quality. It is due to the format.
The typical freight report is built for someone who already knows the difference between a fuel surcharge and a remote area surcharge. It shows zones, weight classes, surcharge codes, and deviations per shipment. For an operations manager, this is useful. For a CFO, it is noise.
And the CFO or business owner is typically the person who must approve any changes. They are the ones who say yes or no to touching a setup that worked the last time someone looked at it.
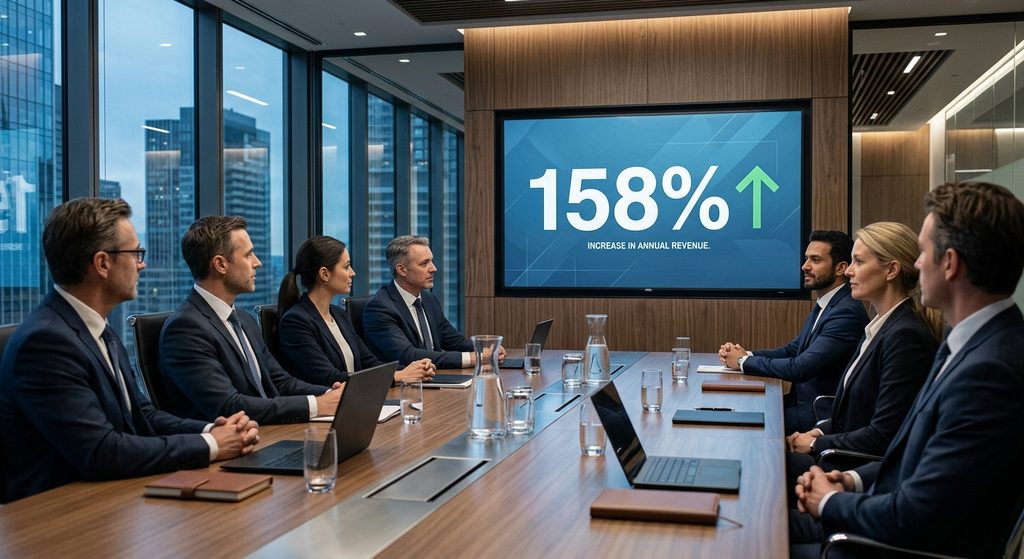
Why Freight Data Often Stays Trapped in Operations
There is a built-in asymmetry. The person who knows freight data best is also the person working closest to the detail. This makes it tempting to present the detail, because that is where the work lies and the insights originate.
However, management makes decisions regarding costs, risk, and capacity. If your presentation does not translate freight data into those dimensions, it is heard as an operational briefing. People nod approvingly, and the agenda item moves on.
Another reason is that freight rarely has a clear owner in management reporting. Freight costs are distributed across purchasing, operations, and customer service, and the internal hours spent on manual booking and invoice verification do not show up as freight costs at all. They are logged as salaries.
Start with the Key Metrics You Are Already Measured On
You do not need to invent a new reporting language. The metrics used to evaluate your own role are already formulated in a language management understands.
- Cost per shipment, broken down both as the freight price and as internal salary hours. The latter figure is often the most surprising because it has never been presented alongside the former.
- Time-to-Ship, meaning the time from an order landing in the system until pickup is approved. This is a service metric, not just an efficiency metric.
- Booking error rate. Manual typos, rejected bookings, and failed pickups. Each of these has a price tag, and that price can be quantified.
- Delivery precision and the number of customer complaints regarding freight. Here, you connect logistics to the customer experience, making the topic relevant to people outside of finance.
- Completed shipments per employee. This is the figure that shows whether the department can grow without hiring more staff.
- If you are a freight forwarder, B2B customer retention belongs in the same picture. Freight data reveals how stable the delivery to your largest customers actually is.
The point is not to show every number. Choose two or three where you can document a trend over time, and leave the rest in the appendix.
The Utilization of Transport Agreements and Freight Data Begins with What the Agreements Actually Contain
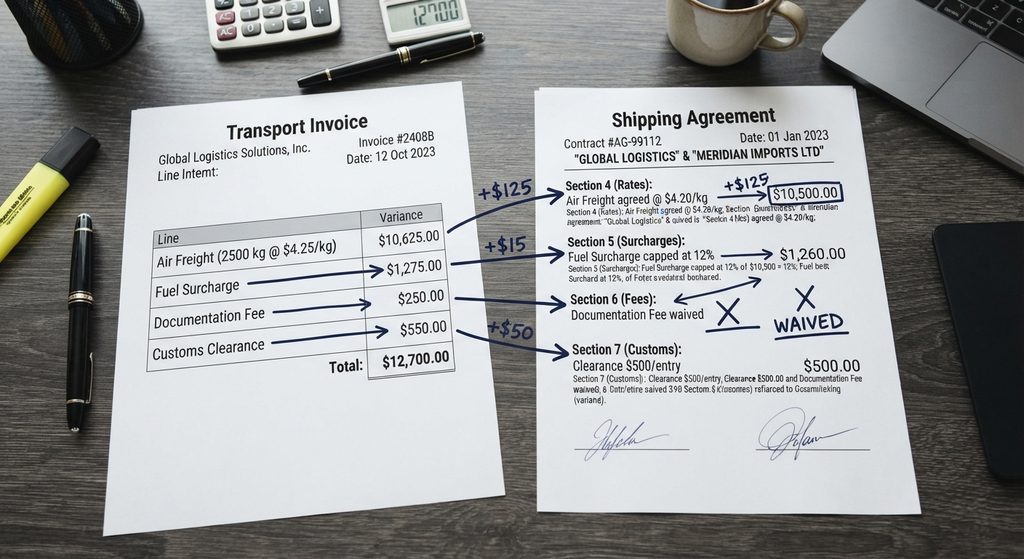
The place where freight data most often becomes interesting to management is the intersection between the agreement and the invoice.
Most companies have multiple carrier agreements, each with its own price structure, surcharges, and volume dependent terms. When bookings are done manually, or when employees have to log into five different portals to get a shipment out the door, choosing a carrier becomes a matter of habit rather than calculation. The agreement exists, but it is not necessarily being used.
This gives rise to three types of questions you can answer with data:
- Which agreement was actually used for the shipments we sent last quarter?
- What proportion of the total freight cost consists of surcharges rather than the base price?
- And how close are we to the volume thresholds that trigger better terms?
The last question is particularly useful in a management presentation because it looks forward rather than taking stock. If shifting volume between two existing carriers pushes you across a threshold, that is a decision management can make without changing systems at all.
Invoice verification belongs to the same exercise. If hours are spent every month manually checking carrier invoices, it is both a cost and a signal that billing cannot be automatically matched against agreements and bookings.
Build the Presentation in Four Parts
A structure that holds up for a twenty-minute management meeting:
- The Starting Point. One number describing the situation. For example, total freight cost per shipment including internal hours.
- The Deviation. Where does the difference lie between what the agreements allow for and what actually happens in operations?
- The Consequence. What does the deviation cost in money, time, and customer complaints? Here, you tie back to the key metrics management knows.
- The Choice. Two or three concrete courses of action with an assessment of what each requires.
Put technical documentation in an appendix. It should be there if someone asks, but it should not be what the meeting is about.
Prepare Answers to Expected Objections
Some reactions are easy to foresee, and they rarely stem from malice:
- “We changed systems two years ago, we can’t change again.” Here, it helps to distinguish between changing platforms and making better use of the agreements you already have. Not all decisions regarding freight data require a system change, and if a change is right after all, your argument becomes stronger once you have first shown what can be gained without one.
- “That sounds expensive compared to what we currently have.” The counter argument is not a price comparison, but an accounting of saved man-hours and reduced errors weighed against the cost. This is the format of calculation a CFO is used to evaluating.
- “Our employees will never accept a new system.” This objection must be taken seriously because it often masks a genuine concern about whether operations can keep running during the transition. Describe how the transition will be handled before anyone asks.
What Weakens the Presentation
Avoid opening with a system demo or screenshots from a booking portal. This shifts the conversation from decisions to tools, and then the rest of the meeting becomes about user interfaces.
Also, avoid presenting savings without showing how they have been calculated. A loose estimate that cannot be verified costs more credibility than it provides impact. A conservative figure that is documented holds up throughout the entire decision-making process.
And avoid presenting freight as an isolated logistics matter. Freight data touches on customer experience, staffing needs, and how quickly you can scale. That connection is why the topic belongs on the management meeting agenda.
FAQ
How often should freight data be on the management agenda? Quarterly is a reasonable starting point for high level key metrics because it provides enough volume for fluctuations to matter. When there is a specific decision regarding carrier agreements or platforms, it belongs on the meeting where the decision is to be made, not in ongoing routine reporting.
What do I do if our data is spread across multiple carrier portals? Then that in itself is one of the numbers that should be included in the presentation. The time spent manually gathering data from multiple portals is a cost, and the lack of a unified overview is why agreements cannot be followed up on. Start by calculating how many hours it takes per month, and which questions you are currently unable to answer.
Should I show savings or risks? Both work, but they appeal to different people. Savings appeal to the finance department, while error rates and delivery precision appeal to the person who owns the customer relationship. If you know the room, weigh your approach accordingly.
Freight data does not become more convincing by being more detailed. It becomes convincing when it is translated into the dimensions management already uses to make decisions. The work of translating it is typically less than the work of gathering the numbers, and that is what determines whether anything actually happens.
Want to see how you can track freight costs, surcharges and the use of your agreements in one place? Book a free demo, and we’ll show you the reports based on your own freight agreements.


