
Most logistics departments are well aware that cheaper ways to ship freight exist. The issue is rarely a lack of will. It is a lack of overview. When shipping volume is split across multiple carriers and bookings take place in different portals, the patterns in the data vanish. Routes that cost more than they should remain hidden among thousands of shipments without anyone noticing.
Leveraging freight agreements and shipping data is precisely about bringing these patterns to light. Not by negotiating new contracts, but by using the ones you already have in the way they were intended.
This article explains how route data across carriers can reveal systematically expensive shipments—and what it takes to shift volume to where the contract actually applies.
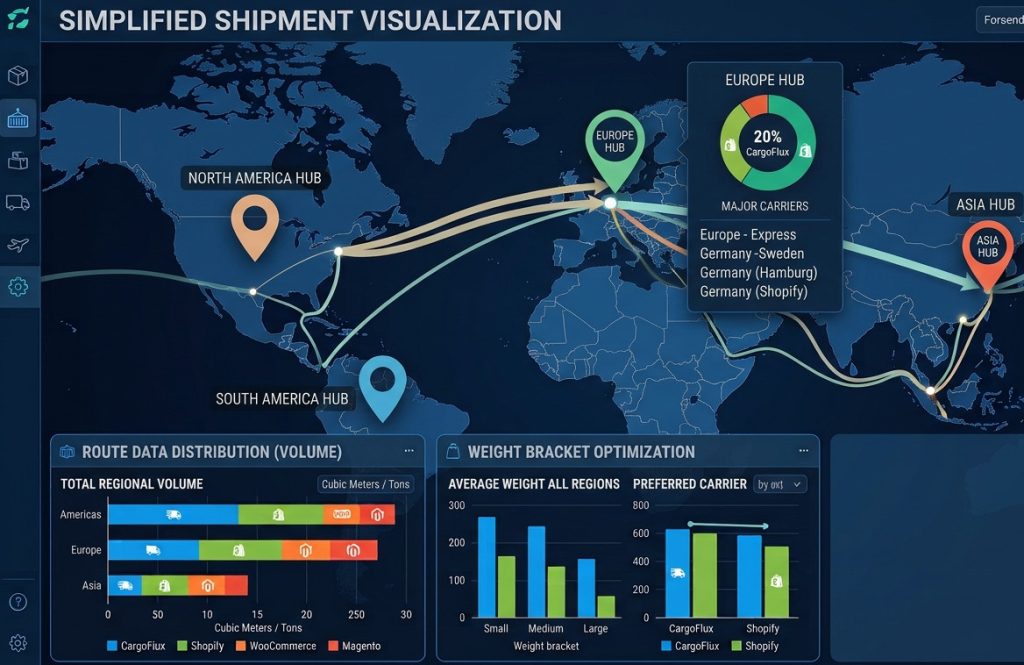
Why Expensive Routes Are Hard to Spot
A shipping contract is rarely a single price. It is a matrix of zones, weight brackets, surcharges, and discounts that apply under specific conditions. One carrier excels on the Jutland-Sweden route. Another offers better rates to Germany for shipments under 500 kg. A third has a pallet contract that is only fully utilized if the volume exceeds a certain threshold.
In practice, bookers often choose the carrier that is easiest to book with, or the one they usually use for that specific route. This is not laziness. It is a rational decision when the alternative is looking up rates in three different portals for every single shipment.
The consequence is that the same route, booked 200 times a year, may be randomly distributed across three carriers, only one of which actually holds the best rate. The price difference per shipment seems minor. Over a year, it becomes substantial.
First Step: Consolidate Data in One Place
This cannot be achieved without consolidating booking data across carriers. As long as information remains in separate systems, you cannot compare route against route.
- At a minimum, the collected data must include:
- Sender and recipient postal code or zone
- Weight and volume
- Carrier and product (package, pallet, LTL/FTL)
- Actual price including surcharges
- Shipment date
Once this is gathered in a single table, you can start asking the questions that matter. Which routes do we ship most frequently? Which carrier did we use for them? What did it cost? And what would it have cost with the others?
Find the Patterns in Route Data
With data consolidated, you can group shipments by route and weight bracket. The goal is to identify combinations where the volume is high enough that misallocation costs real money.
A typical analysis looks like this: Take all shipments between two postal code areas within a specific weight bracket. See how many were booked with each carrier and what the average price was. Compare this with what the price would have been with the carrier whose contract is strongest for that exact route and weight.
It is not unusual to find routes where 60 percent of the volume is booked with a carrier that is 15–25 percent more expensive than the alternative. Not because anyone made a deliberate bad choice, but because the booking occurred in whichever system was closest at hand, without a side-by-side comparison.
The Three Types of Expensive Routes
When you start digging into the numbers, three types of issues typically emerge:
Routes where volume is in the wrong place. The agreement with Carrier A is strongest on a given route, but the majority of your shipments are booked with Carrier B. The solution is rarely renegotiation. It is moving the bookings.
Routes where the weight bracket tips the price. A contract might be competitive up to 300 kg and significantly more expensive above it. If a large portion of shipments sits just over the threshold, it pays to either consolidate or split shipments to hit the bracket where the contract actually applies.
Routes where surcharges eat the discount. The base price looks reasonable, but fuel surcharges, residential surcharges, or weekend surcharges drive the total cost higher than the alternative. This is often the hardest to spot because surcharges appear on the invoice, not during booking.
From Analysis to Decision
An analysis is only valuable if it leads to a change in booking behavior. That requires two things:
First, insights must be translated into actionable rules for the booker. Not a lengthy report, but a concrete instruction: “Pallet shipments to the 8000 area under 500 kg are booked with Carrier X.” It needs to be that simple.
Second, the booking process must support the rule. If the booker still needs to log into three separate portals and remember which rule applies to which route, compliance will slip. This is why a unified booking platform isn’t just about convenience—it is the prerequisite for turning analytical insights into actual savings.
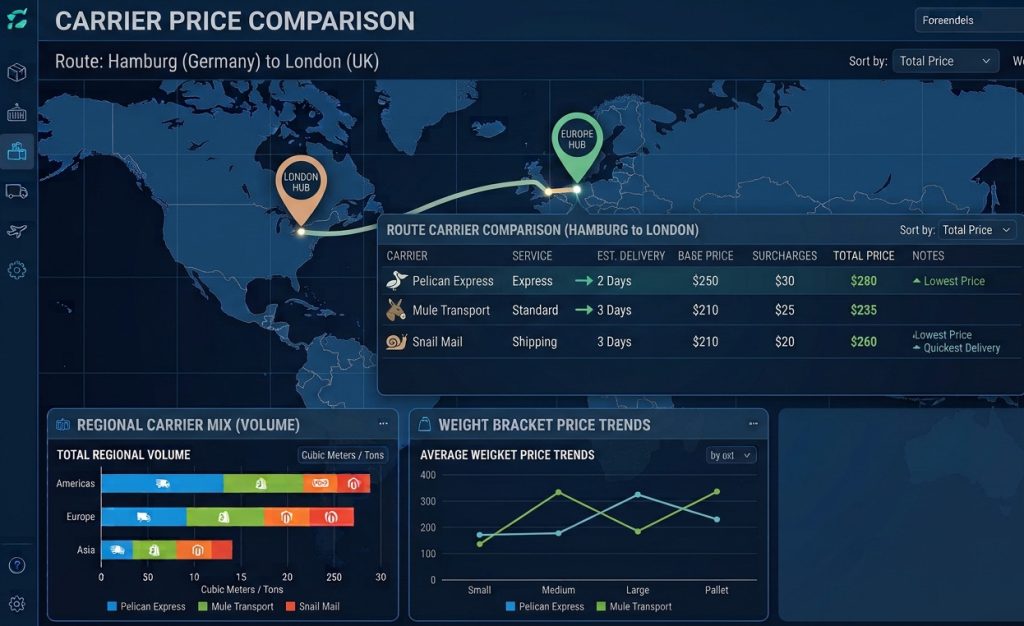
What You Achieve
The overall impact varies, but the logic remains consistent. When volume is directed to where contracts are strongest, average freight costs decrease without renegotiating a single contract. You simply maximize the terms already agreed upon. Secondarily, you gain a far more accurate foundation for your next round of contract negotiations. You will know exactly which routes and weight brackets matter, where your volume lies, and where potential exists to consolidate further. The negotiation becomes fact-based rather than theoretical.
FAQ
How large does a company need to be before analyzing route data like this makes sense?
The deciding factor is not employee headcount, but shipment volume and the number of carriers used. If you ship more than a few hundred parcels or pallets a month spread across two or more carriers, there are usually patterns to uncover. At lower volumes, individual price differences are often too small to justify the effort of the analysis.
Can’t you just ask the carriers for reports?
Yes, but those reports only cover that specific carrier’s shipments. The point is to compare across all your carriers. As long as data stays siloed with individual providers, you cannot see where volume should have gone elsewhere.
How often should this analysis be conducted?
Contracts and surcharges change, and so do shipping patterns. An annual review is the bare minimum. If you experience major changes in product assortment, customer base, or carrier contracts, it should be done more frequently. With data centralized in one place, the analysis can effectively run continuously.
Route data is rarely a source of dramatic, single-figure savings. There is no single massive number waiting to be discovered. Instead, there are many small discrepancies that compound over time simply because bookings land in the wrong place. That is precisely why the work is worth doing. The contracts are already in place—it is just a matter of using them.

