
See what your freight really costs, and what it earns
The analytics module turns every shipment into insight: volumes, weight, cost and revenue per month, delivery times, customer activity and CO₂, filtered by period, customer and carrier.

Why analytics?
Freight data is usually spread across carrier portals, invoices and spreadsheets. Cargoflux already holds every shipment, cost and sales price, so the numbers are ready the moment you need them, without exports or manual reports.
What you can see
Customer trends: spot growth and churn early
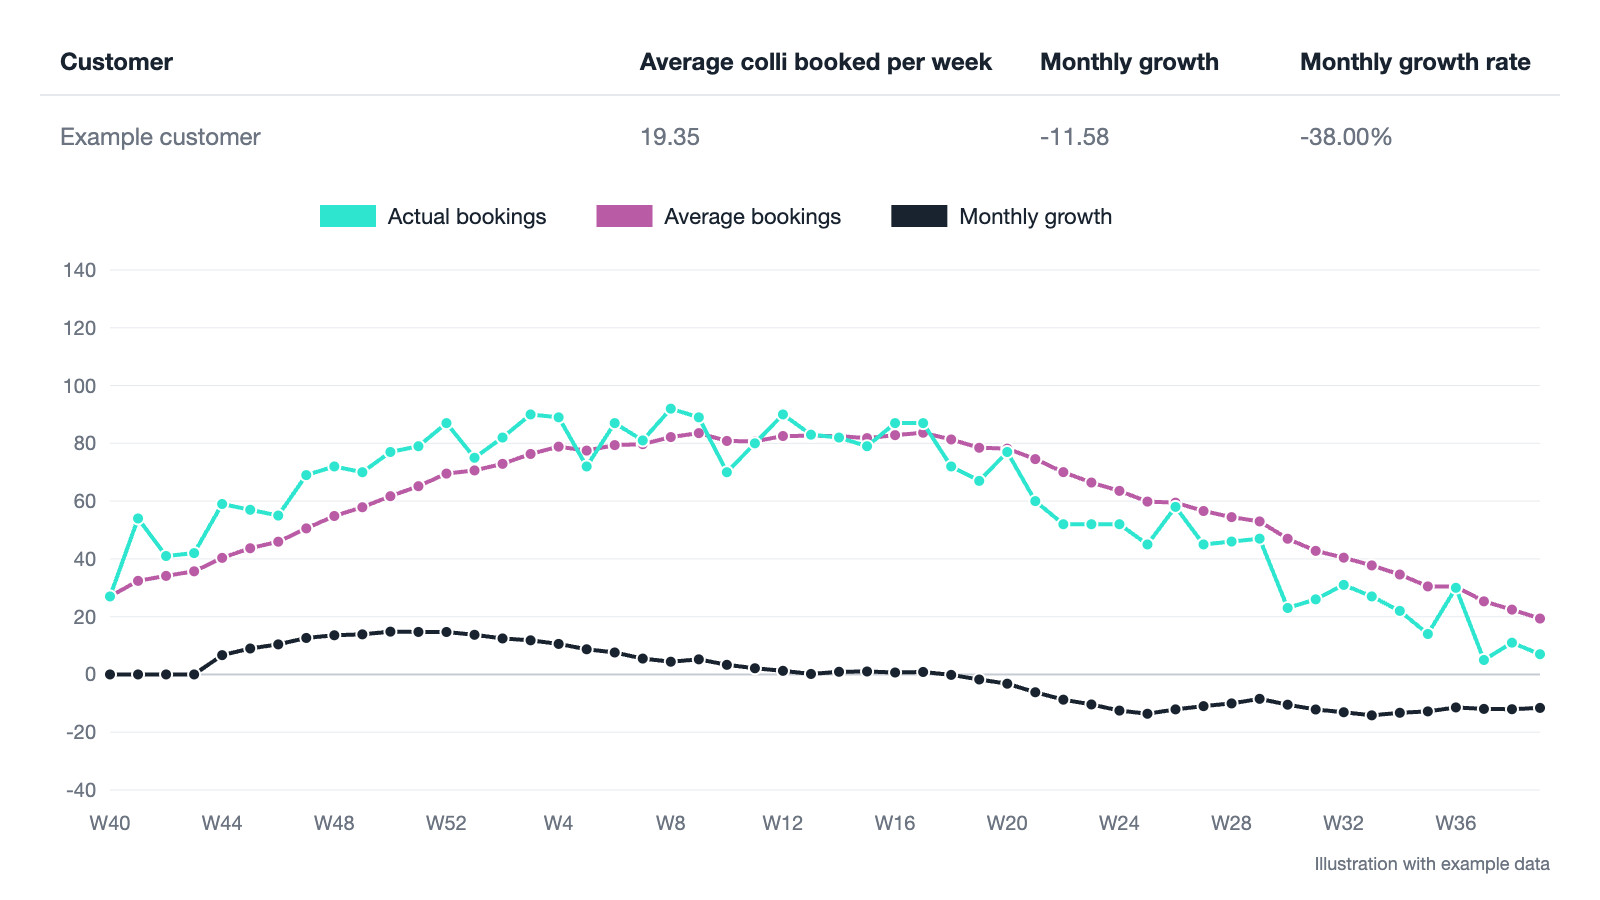
The customer trends view shows how each customer is developing, week by week. For every customer you see the actual number of bookings, a smoothed booking average and the monthly growth, so you can tell at a glance who is growing, who is stable and who is slowing down.
CO₂ reporting
Cargoflux estimates the CO₂ of every option at booking and creates a monthly CO₂ report as a PDF, per customer and per carrier. Reports for other periods are available on request. The calculation is based on distance, weight and the emission rate of each transport product, with GHG Protocol default values where no specific rate is available. CO₂ reporting is available as a paid add-on to the analytics module. The same estimate is shown for every option in the booking overview, so shippers can see how green a carrier is before they choose. Read about price comparison.
Scheduled billing reports
Frequently asked questions
Are you ready to optimise your logistics?
Get a free demo and find out how Cargoflux can help your business


